Function and equation graphs
Each example below is a standalone .eido project holding a single figure that plots a function, a parametric curve, a polar curve or an implicit equation and then animates the numbers inside it. Every download uses the current .eido format (manifest version: 2) and contains editable Eidolang source.
After downloading, choose Open in the app header and select the file, or drop the .eido file onto the app. You do not have to install anything: the View in Viewer link plays the project in the browser.
The image in each section is a PNG exported from the same figure with Eidograph's export tool, with the coordinate grid turned on, and shows one frame of the timeline. Open the file to play the whole animation and to drag the sliders yourself.
Function graphs
Sine Wave Parameters
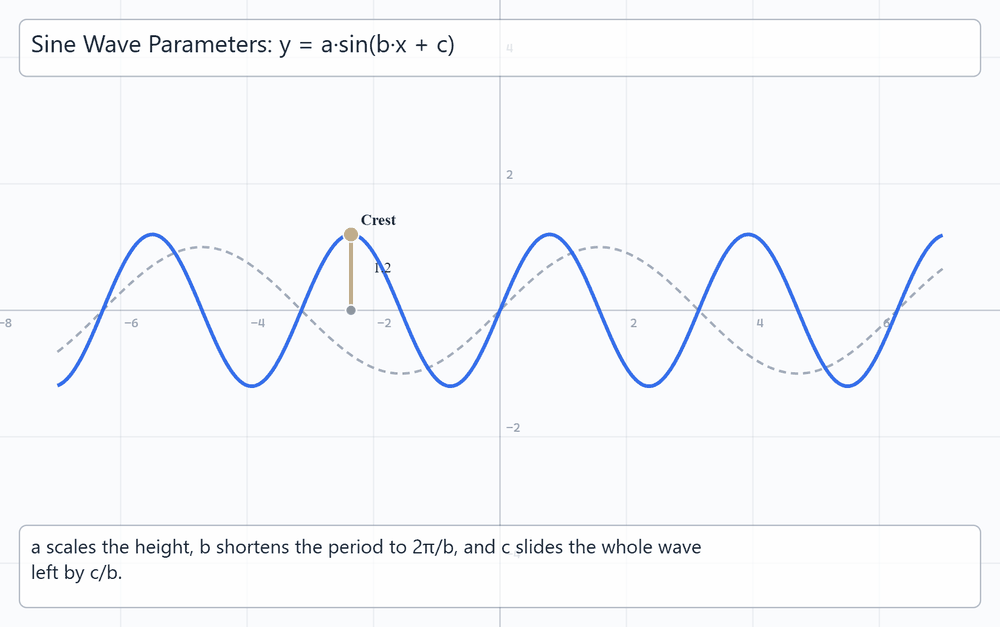
This example shows how to make an animation to demo what the three numbers in y = a·sin(b·x + c) do to a sine wave. A dashed grey curve stays at y = sin x while a, b and c each move in their own stage, and an orange segment reads the crest height.
Download sine-wave-parameters.eido · View in Viewer
Quadratic Vertex Form
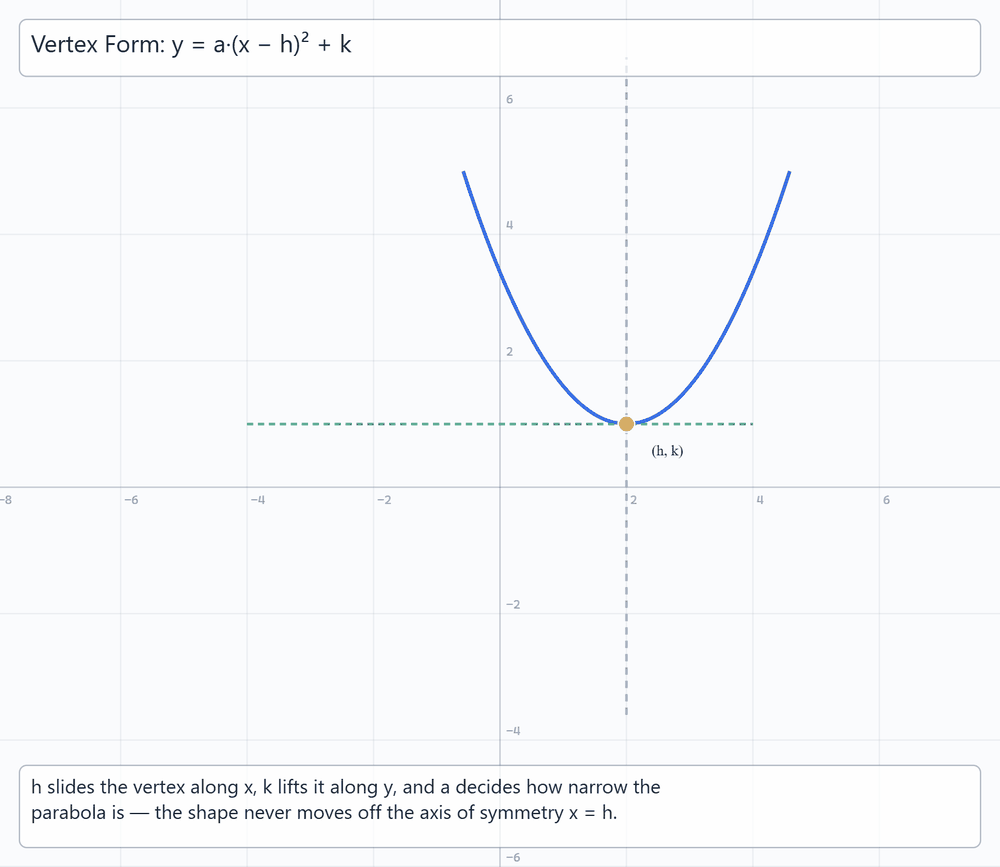
This example shows how to make an animation to demo the vertex form of a quadratic, y = a·(x − h)² + k. The vertex is a derived point, a locus records its track as h moves, and an assertion checks that the curve really passes through (h, k).
Download quadratic-vertex-form.eido · View in Viewer
Shifting and Scaling a Graph
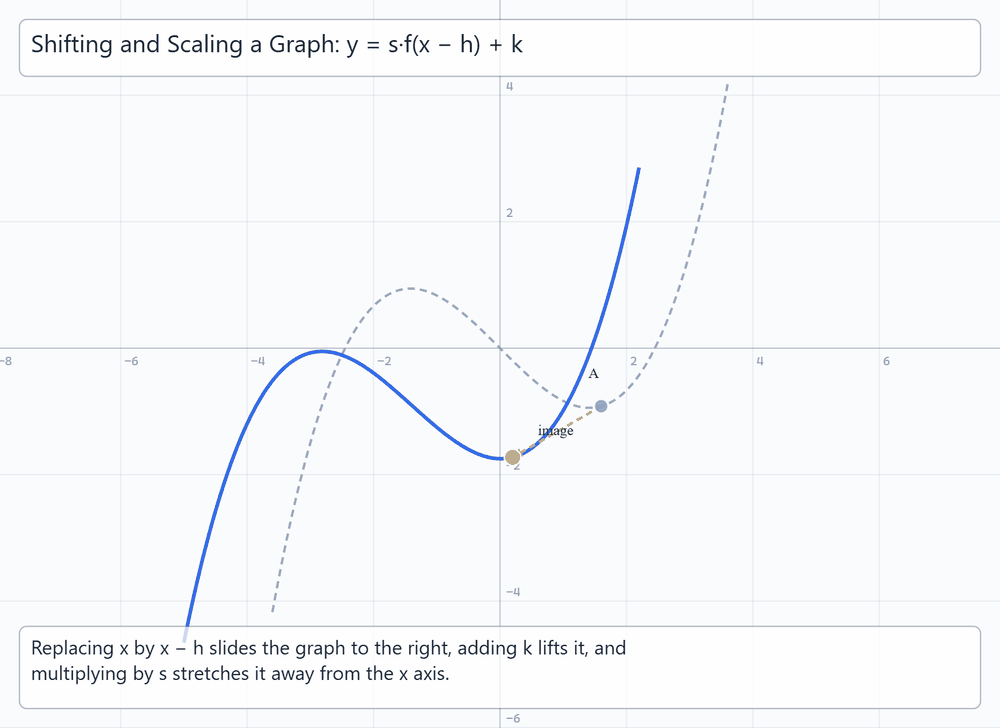
This example shows how to make an animation to demo what a shift and a stretch do to the graph of a function. A marked point on the base curve is joined by a vector to its image, and h, k and s take turns moving.
Download graph-transformations.eido · View in Viewer
Exponential and Its Inverse
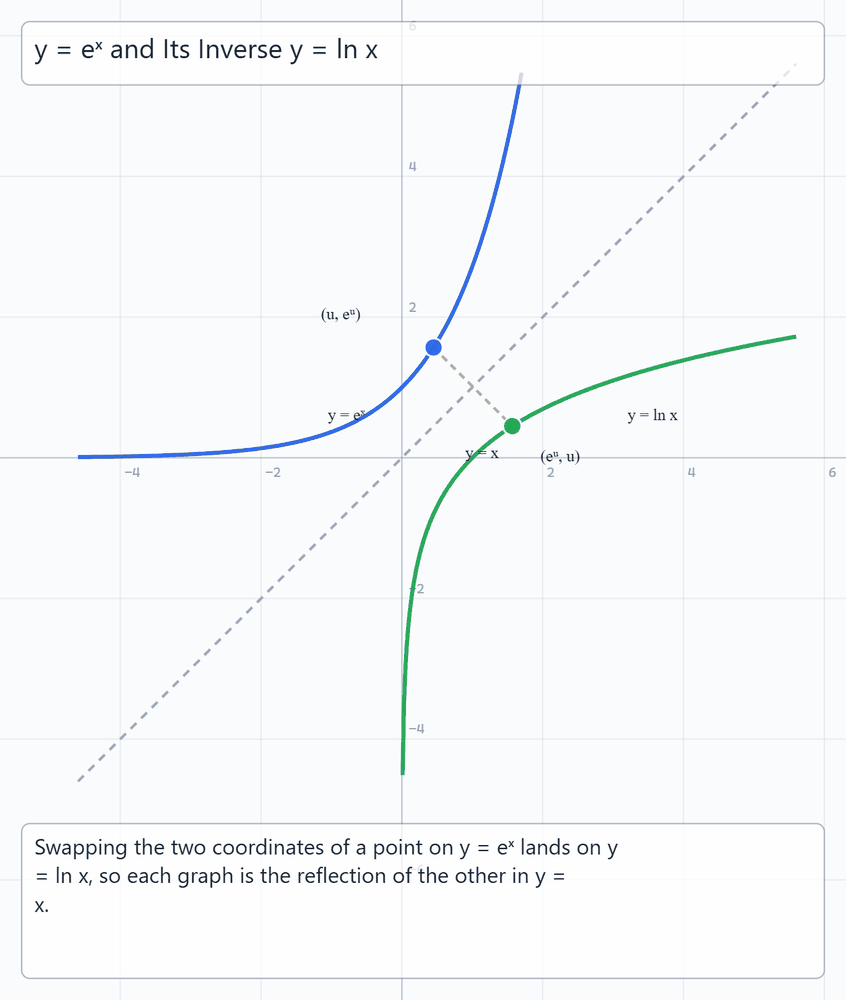
This example shows how to make an animation to demo why the graphs of eˣ and ln x are mirror images. A point runs along the exponential while its swapped coordinates ride the logarithm, and two assertions check the reflection in y = x.
Download exponential-and-its-inverse.eido · View in Viewer
Polynomial Roots and Factors
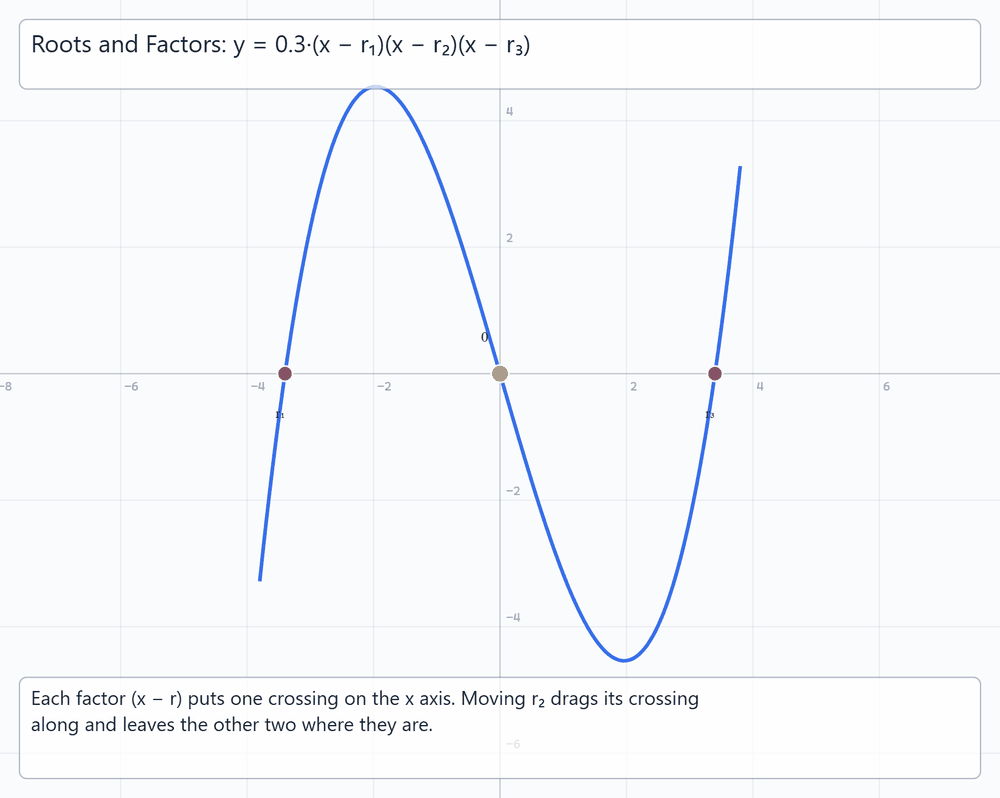
This example shows how to make an animation to demo the link between the factors of a polynomial and the crossings of its graph. The middle root slides along the x axis and drags exactly one crossing with it while the other two stay put.
Download polynomial-roots-and-factors.eido · View in Viewer
Damped Oscillation
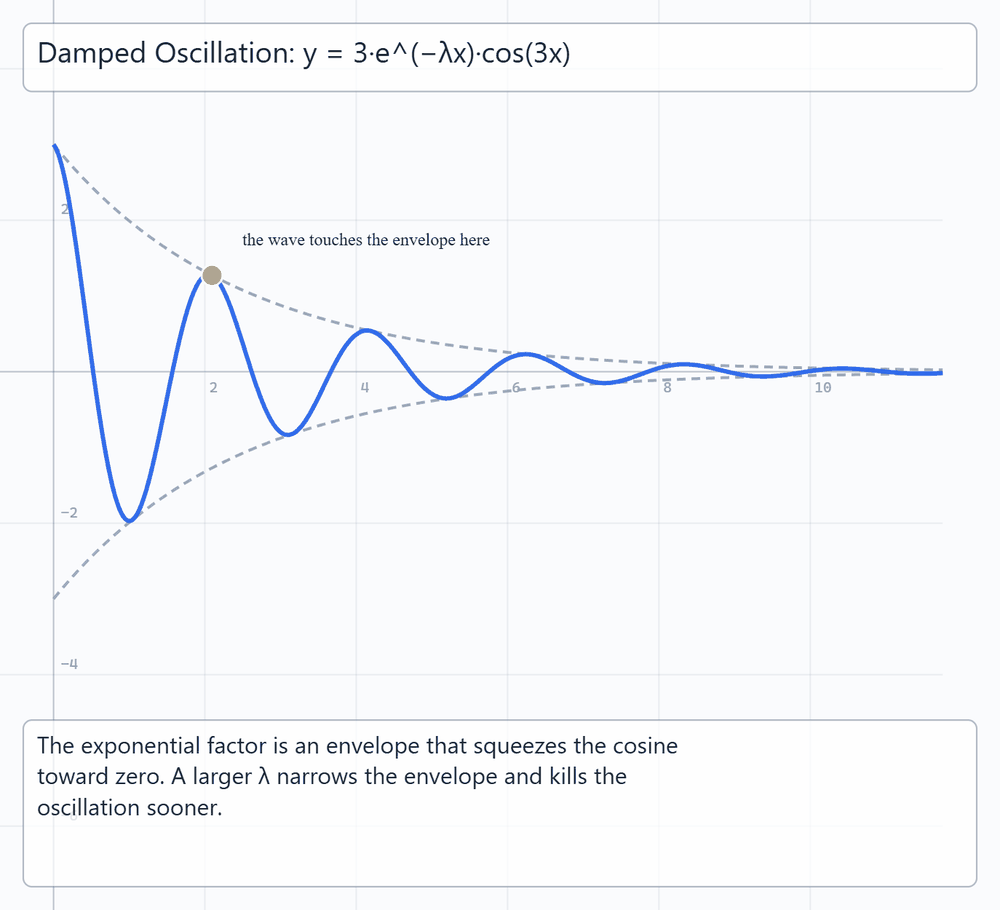
This example shows how to make an animation to demo how an exponential envelope damps an oscillation. Three plots share the damping parameter, and a marked point sits where the wave touches its envelope.
Download damped-oscillation-envelope.eido · View in Viewer
Beats from Two Sine Waves
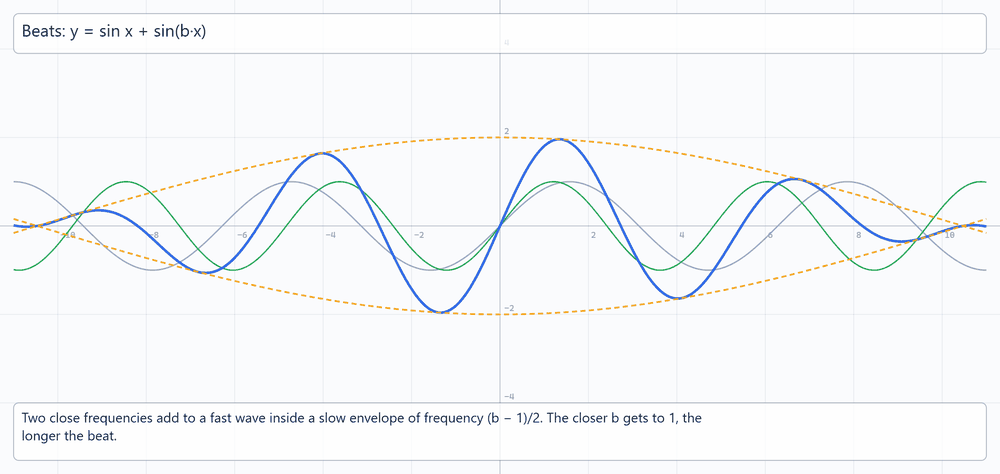
This example shows how to make an animation to demo the beats produced when two close frequencies are added. Two sine plots and their sum are drawn with the slow envelope, and an assertion checks the sum-to-product identity.
Download beats-from-two-sine-waves.eido · View in Viewer
Calculus in motion
From Secant to Tangent
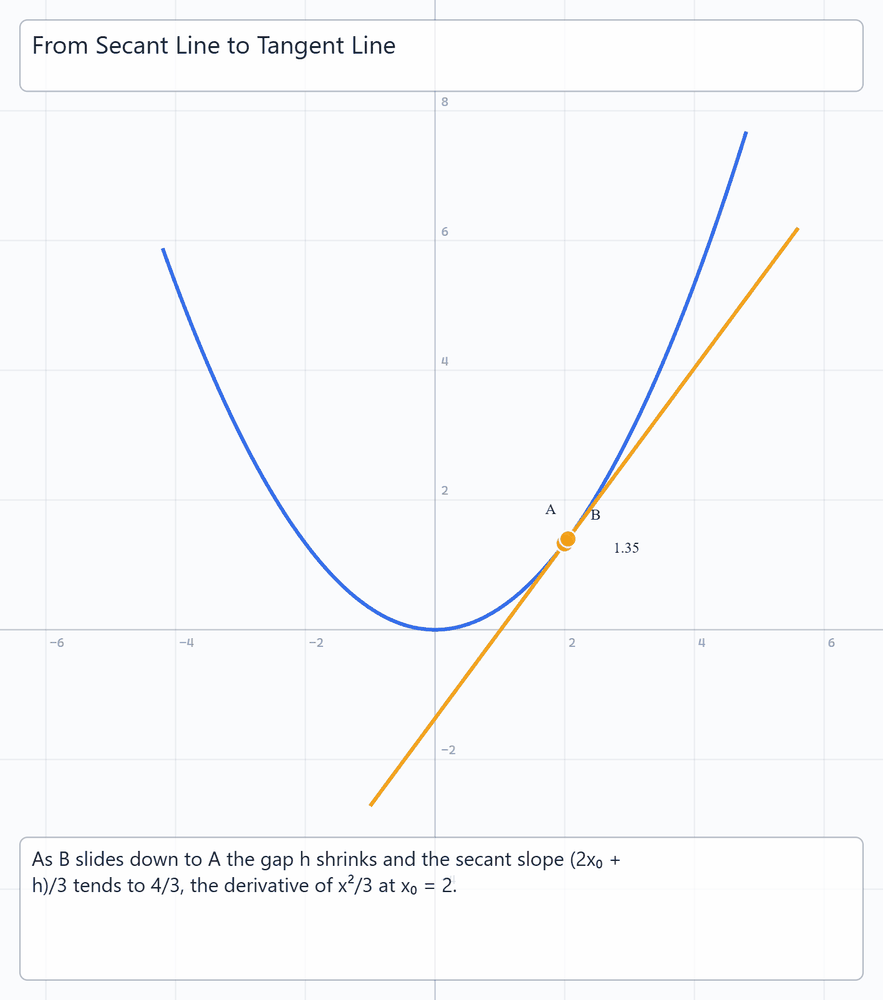
This example shows how to make an animation to demo the limit that turns a secant line into a tangent. The gap shrinks toward zero while a live label reads the secant slope, which settles on the derivative 4/3.
Download secant-to-tangent.eido · View in Viewer
The Derivative Graph
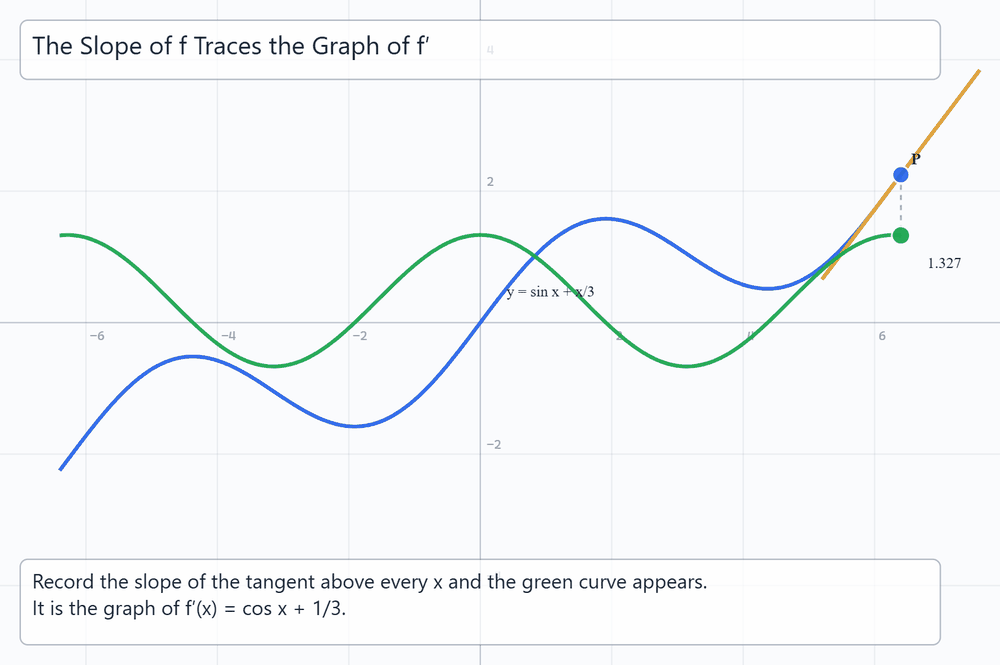
This example shows how to make an animation to demo how the slope of a tangent traces out the derivative. A locus records the slope as a height above each x, and the green curve that appears is the graph of f′.
Download derivative-graph-from-slope.eido · View in Viewer
Taylor Polynomial of the Sine
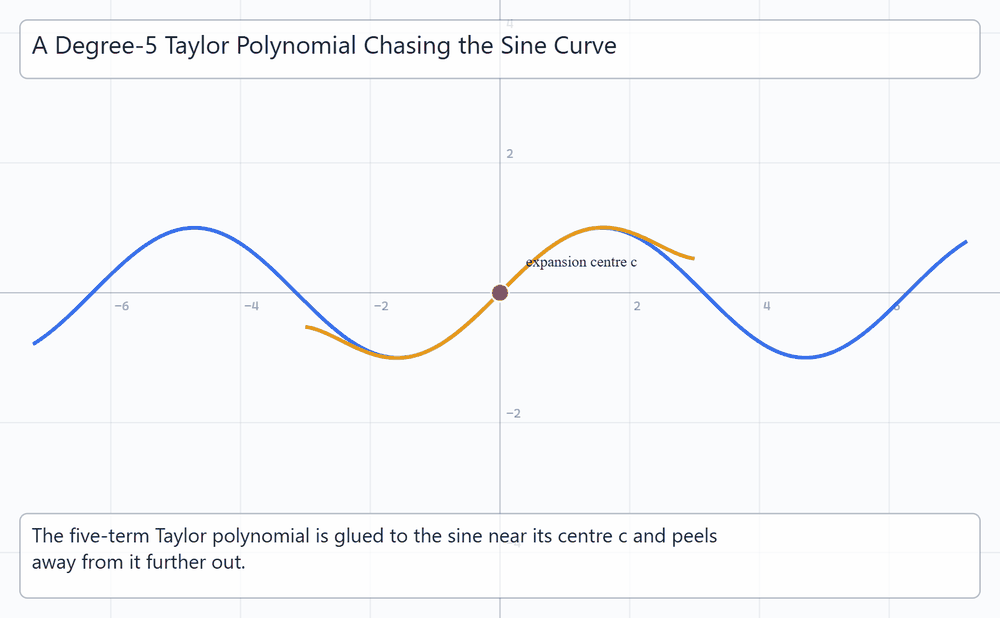
This example shows how to make an animation to demo how closely a degree-5 Taylor polynomial follows the sine. The expansion centre travels along the curve and the polynomial is rebuilt around it on every frame.
Download taylor-polynomial-of-sine.eido · View in Viewer
Newton's Method
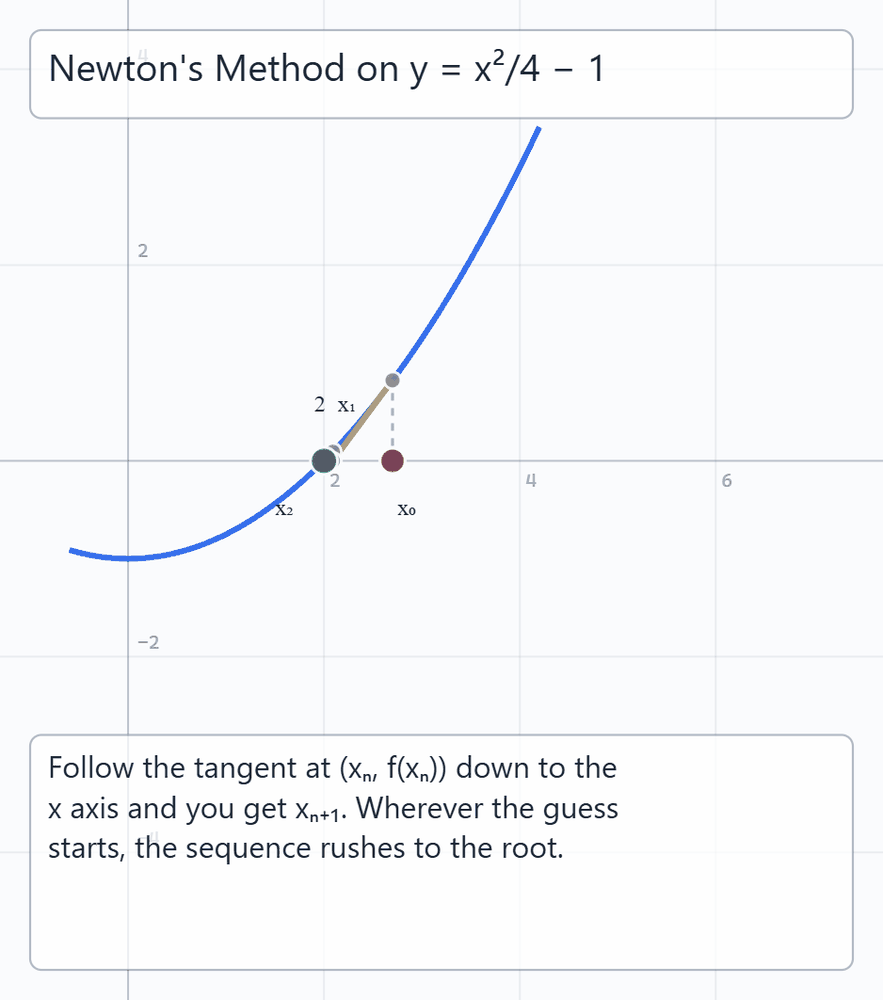
This example shows how to make an animation to demo how Newton's method chases a root with tangent lines. Three iterations are derived from the starting guess, and an assertion checks that the third already lands within 0.02 of the root.
Download newtons-method-iteration.eido · View in Viewer
Riemann Sum Rectangles
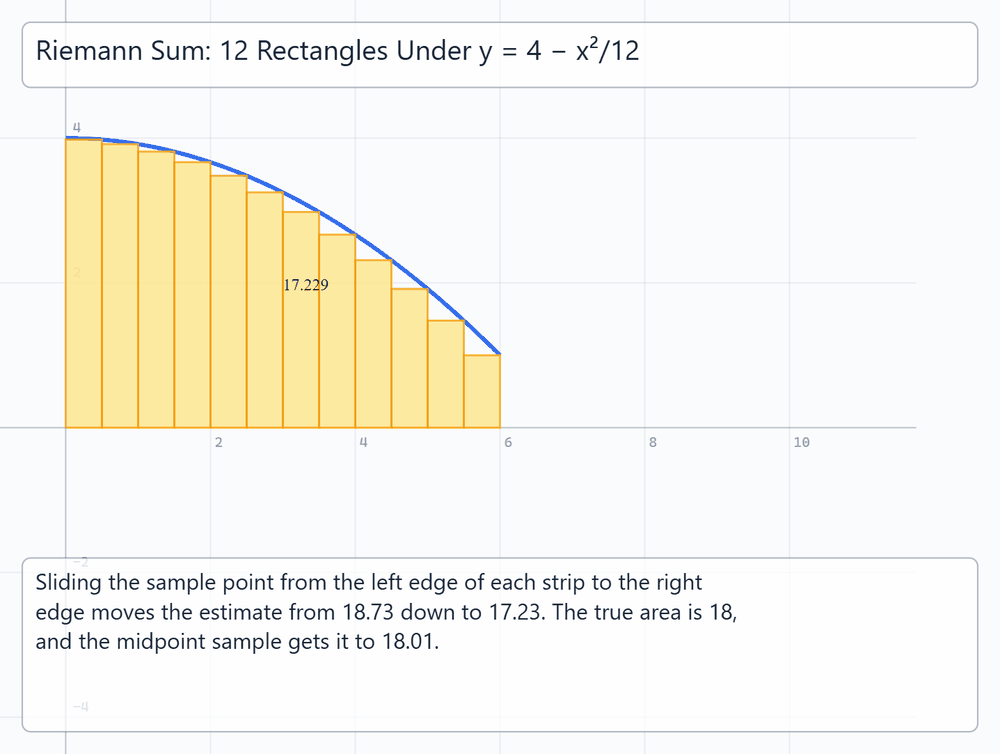
This example shows how to make an animation to demo how the choice of sample point changes a Riemann sum. Twelve rectangles slide their sample point from the left edge of each strip to the right, and a live label reads the running estimate.
Download riemann-sum-rectangles.eido · View in Viewer
Equations and conics
Ellipse from Its Equation
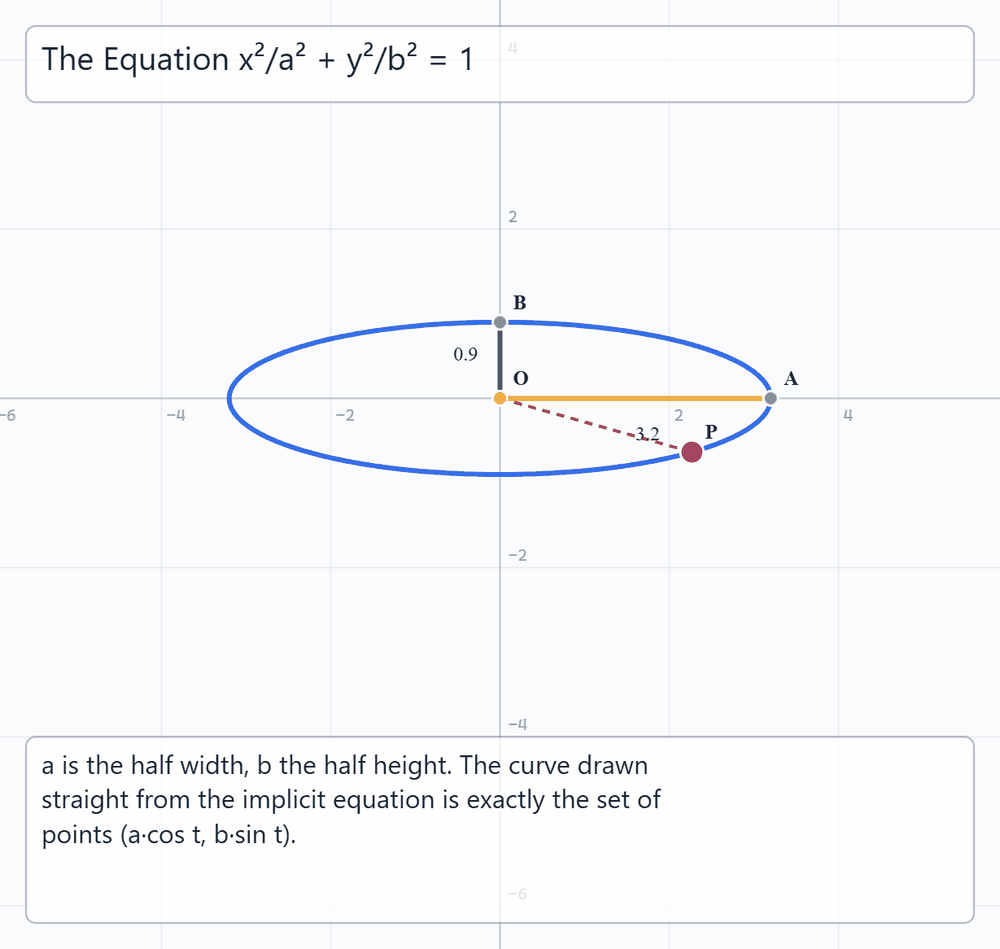
This example shows how to make an animation to demo the ellipse drawn straight from x²/a² + y²/b² = 1. The implicit equation is redrawn as a and b move, and a point travelling as (a·cos t, b·sin t) is asserted to satisfy it.
Download ellipse-equation-and-axes.eido · View in Viewer
Hyperbola and Its Asymptotes
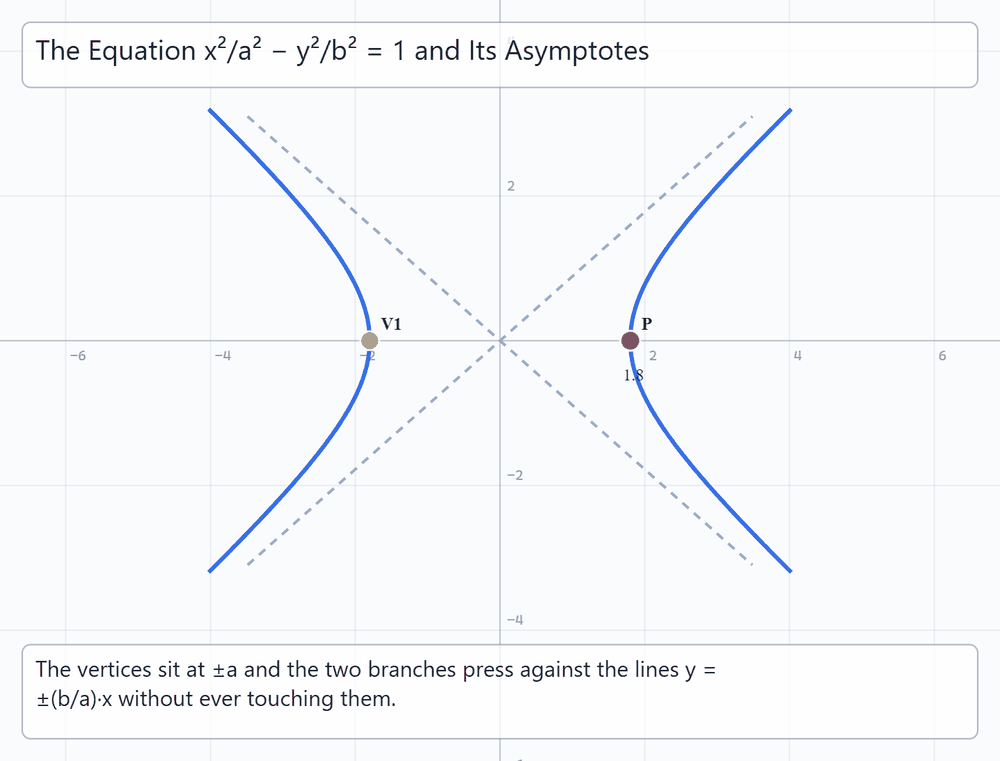
This example shows how to make an animation to demo how a hyperbola presses against its asymptotes without touching them. The vertices move with a while the dashed lines keep the slopes ±b/a and a parametric point stays on the right branch.
Download hyperbola-and-asymptotes.eido · View in Viewer
Superellipse Family
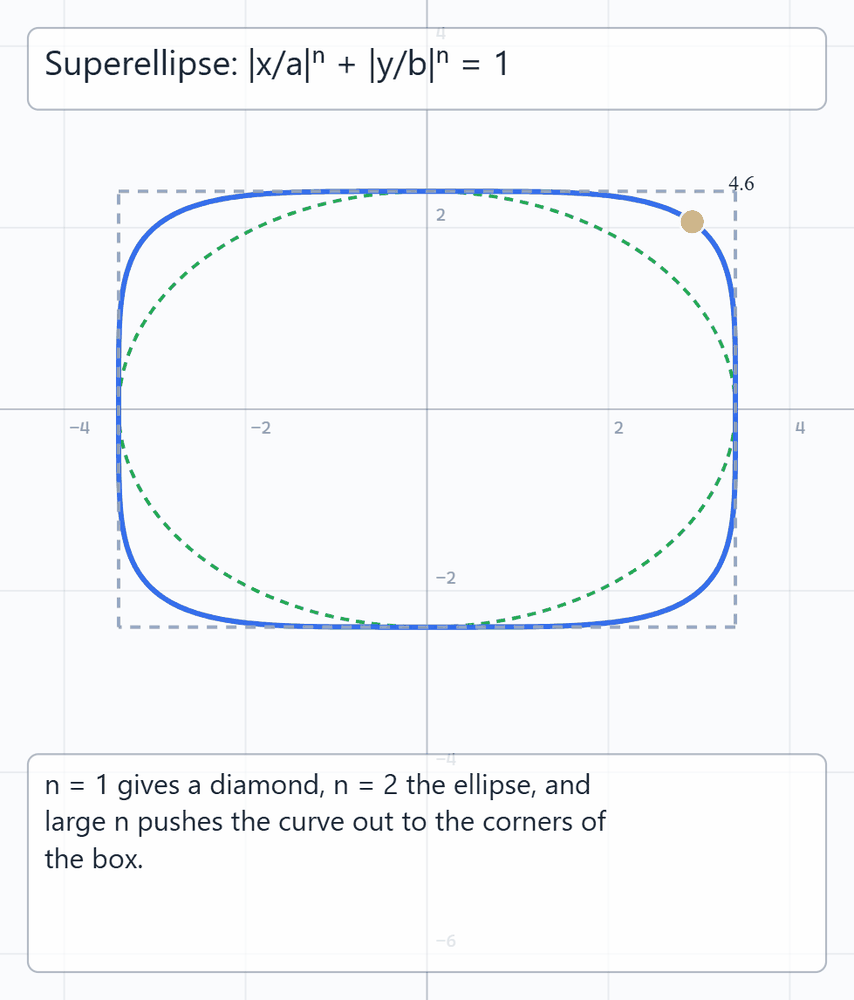
This example shows how to make an animation to demo the family of curves |x/a|ⁿ + |y/b|ⁿ = 1. The exponent runs from 0.6 to 6, carrying the curve from a pinched star through the ellipse to a rounded rectangle.
Download superellipse-family.eido · View in Viewer
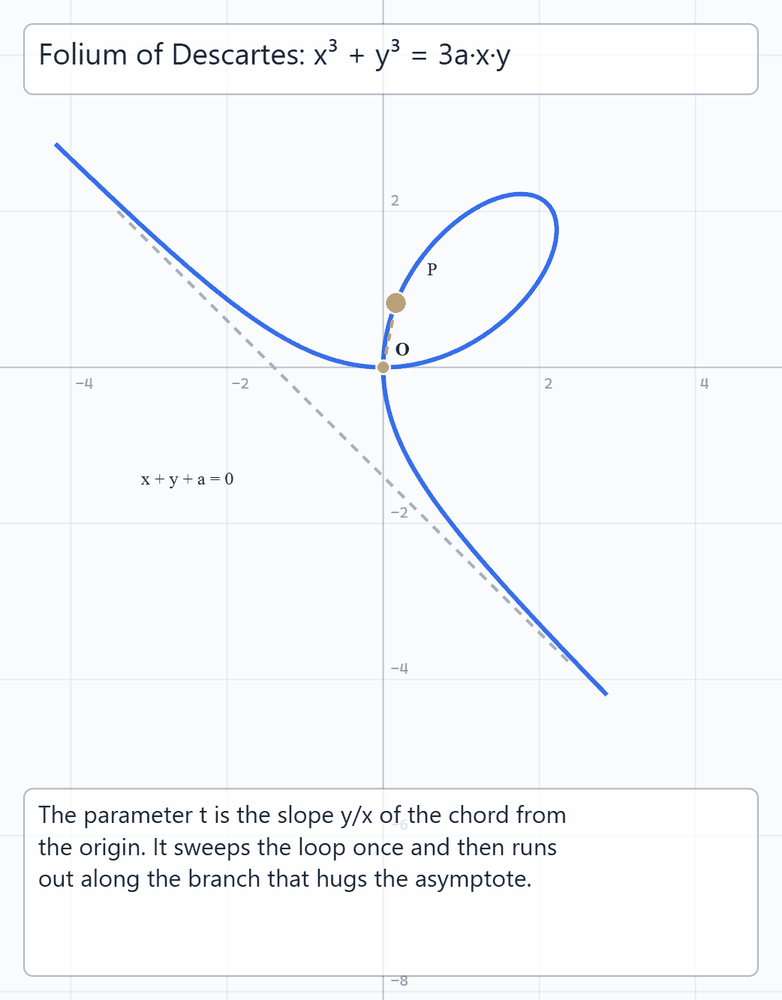
Folium of Descartes
This example shows how to make an animation to demo the folium of Descartes and the asymptote its branches follow. A parametric point sweeps the loop while the implicit cubic is redrawn for each value of a.
Download folium-of-descartes.eido · View in Viewer
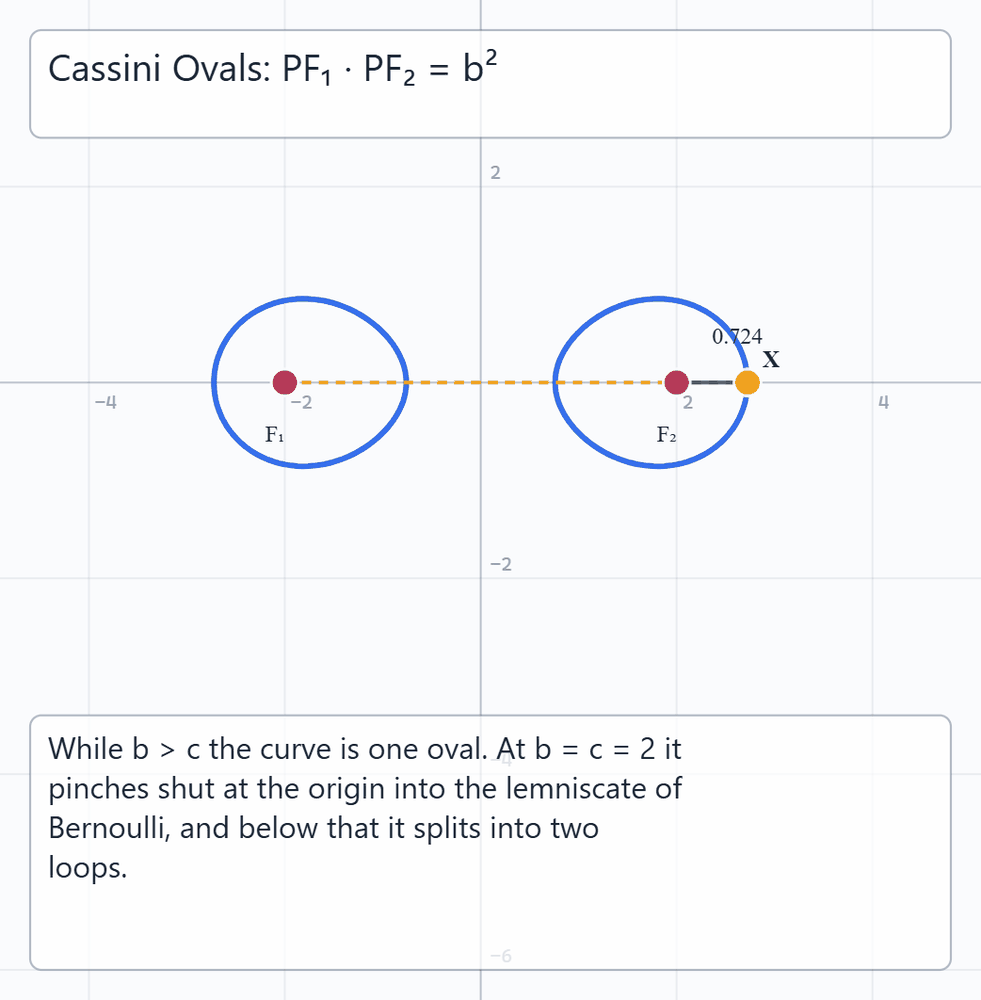
Cassini Ovals and the Lemniscate
This example shows how to make an animation to demo the curves on which the product of two focal distances is constant. Shrinking the constant pinches one oval into the lemniscate of Bernoulli and then splits it into two loops.
Download cassini-ovals-and-lemniscate.eido · View in Viewer
Parametric and polar curves
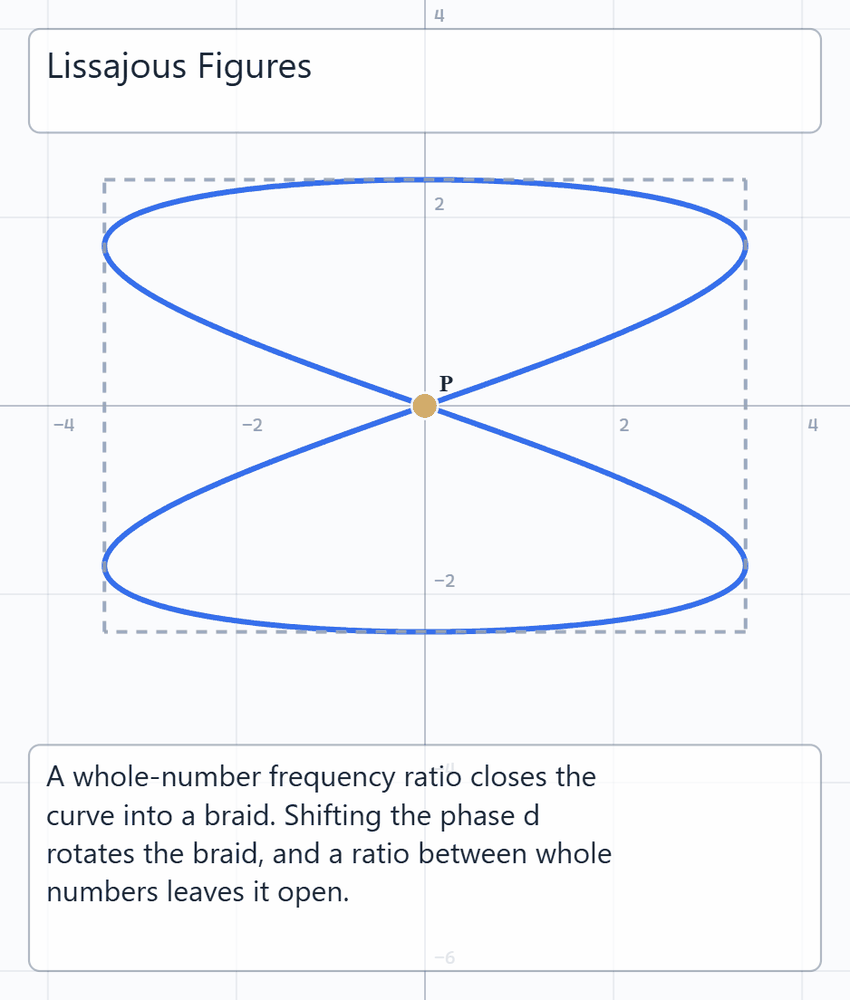
Lissajous Figures
This example shows how to make an animation to demo the braided curves made by two perpendicular oscillations. A rider travels the curve first, then the phase and the frequency ratio each take a turn.
Download lissajous-figures.eido · View in Viewer
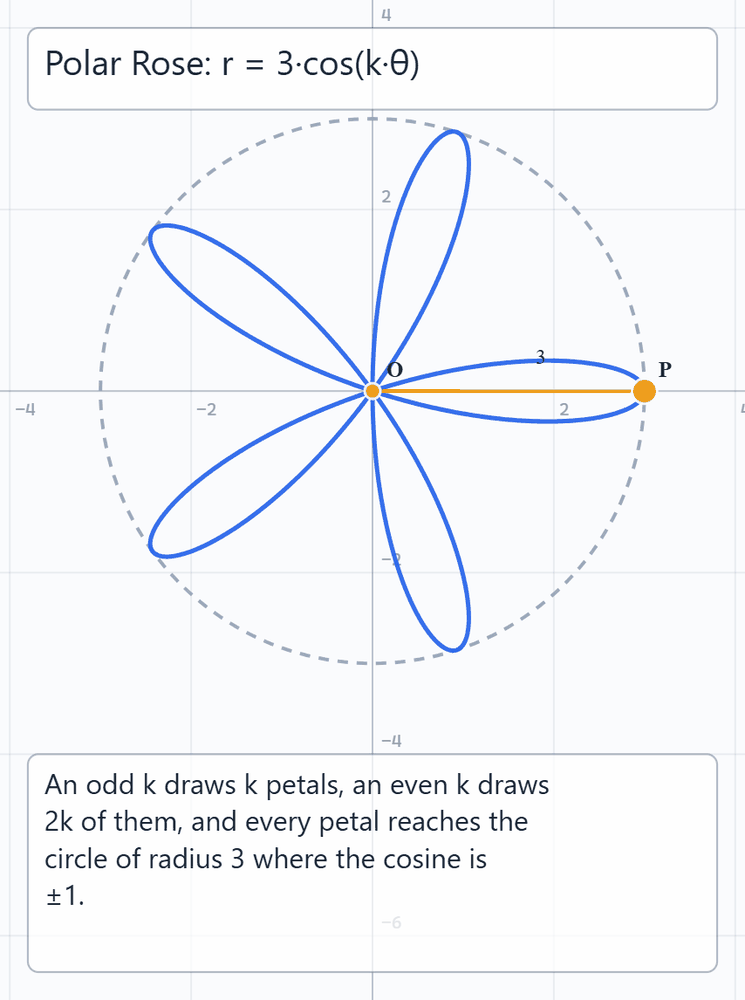
Polar Rose
This example shows how to make an animation to demo how the petal count of r = 3·cos(k·θ) depends on k. A sweeping arm reads the current radius while k grows from 2 to 8.
Download polar-rose.eido · View in Viewer
Limaçon and Cardioid
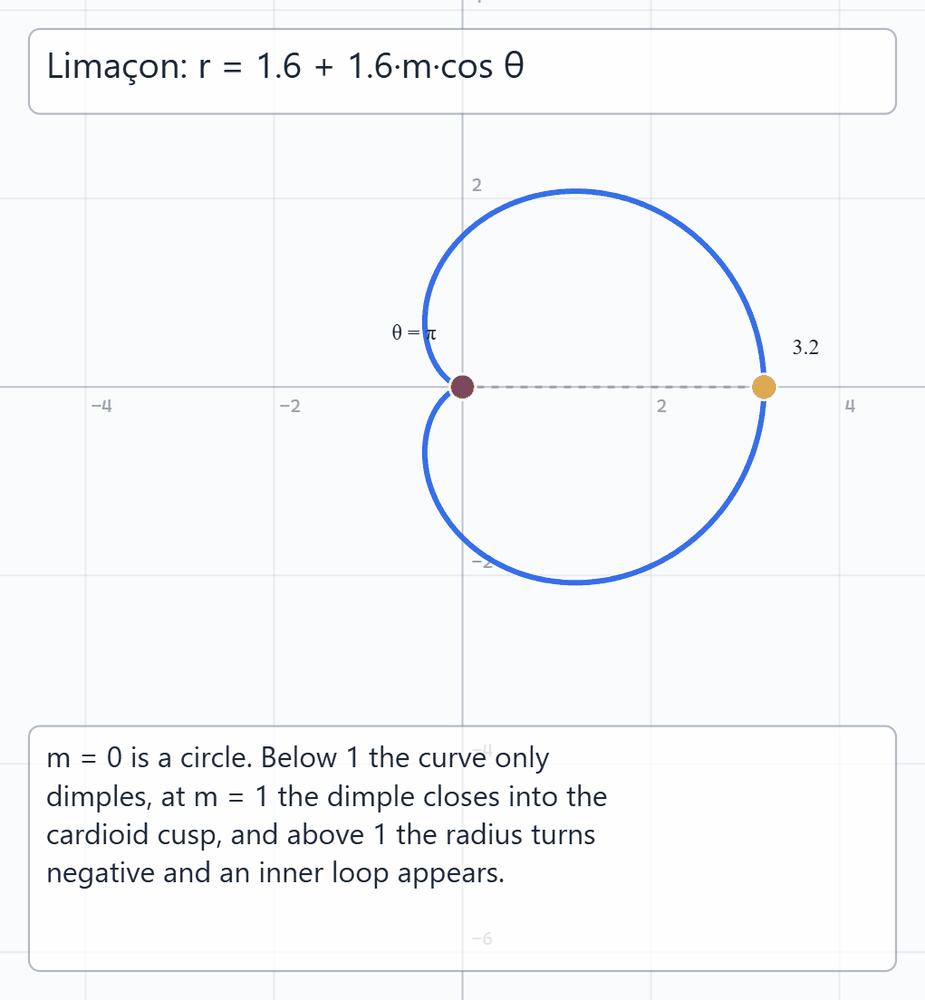
This example shows how to make an animation to demo the limaçon family and the cardioid hiding inside it. One shape parameter carries the curve from a circle through the cardioid cusp to a curve with an inner loop.
Download limacon-and-cardioid.eido · View in Viewer
Archimedean Spiral
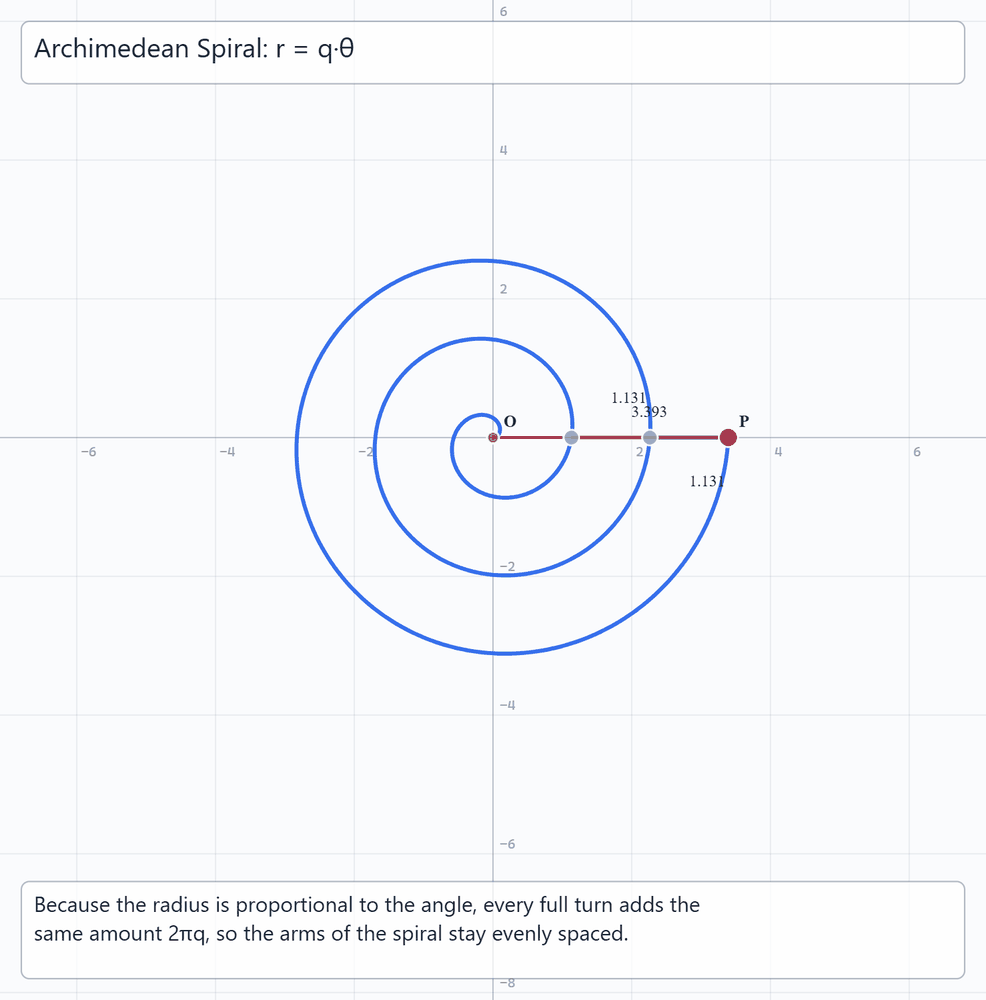
This example shows how to make an animation to demo why the turns of an Archimedean spiral are evenly spaced. Two coloured segments measure consecutive gaps on the x axis and an assertion checks that they stay equal.
Download archimedean-spiral.eido · View in Viewer
Spirograph Epitrochoid
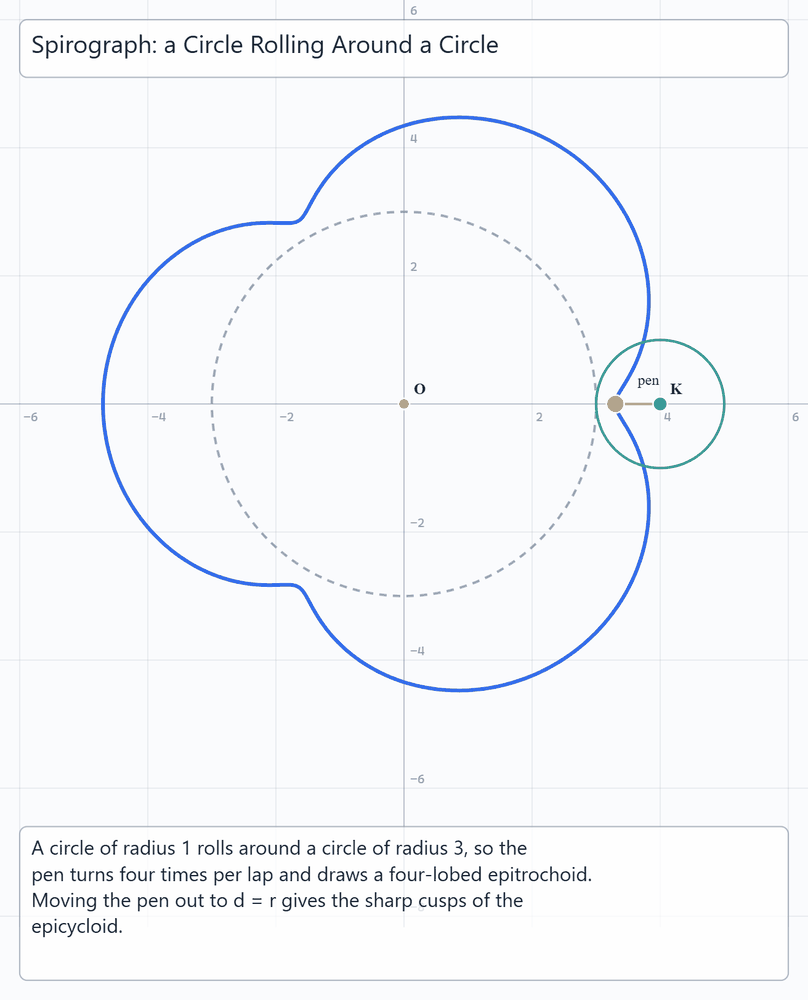
This example shows how to make an animation to demo the curve a spirograph pen draws as one circle rolls around another. The rolling circle stays tangent to the fixed one while the pen arm sweeps out a four-lobed epitrochoid.